In the last post I covered what gRPC is and how to use it, and I ended by saying I’d go run some actual tests — to see just how much you actually gain from this “trade readability for performance” approach. This post is that test log.
The code lives in a separate repo: the grpc_test folder in Clark1945/java. The main files:
- gRPC server side:
OrderServiceImpl.java,SensorServiceImpl.java - REST control group:
HttpBenchmarkServer.java,HttpBenchmarkClient.java - Benchmark entry point:
StreamingVsHttpBenchmark.java
Test Design
This round focuses on one scenario: bulk transfer of large volumes of data, split into two comparisons:
| Scenario | gRPC RPC | REST counterpart |
|---|---|---|
| Bulk upload (client streaming) | SensorService.ReportReadingsBatched | POST /sensor-readings (one shot, whole JSON array) |
| Bulk download (server streaming) | OrderService.ListOrdersBatched | GET /orders (one shot, whole JSON array) |
Other settings:
- Record counts: 1,000 / 10,000 / 100,000 / 500,000 / 1,000,000
- Fields per record: 8 (
SensorReading: device_id, value, timestamp, unit, location, battery_level, status, firmware_version;OrderResponse: order_id, amount, currency, status, created_at, customer_id, item_count, shipping_address) - gRPC batch size: 1,000 records per stream message
- Test environment: local loopback (same machine, gRPC server on port 9091, HTTP server on port 8081), JVM started with
-Xmx3g
Results
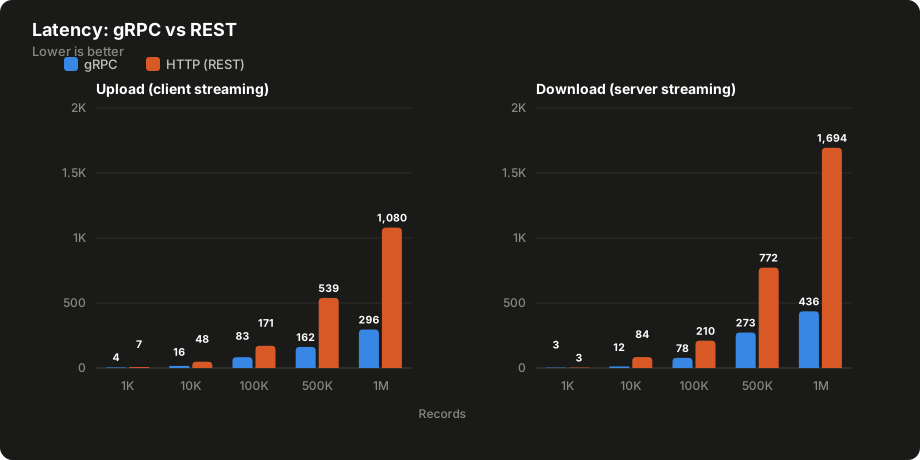
Both scenarios — bulk upload (client streaming) and bulk download (server streaming) — were measured for latency (ms) from 1,000 up to 1,000,000 records:
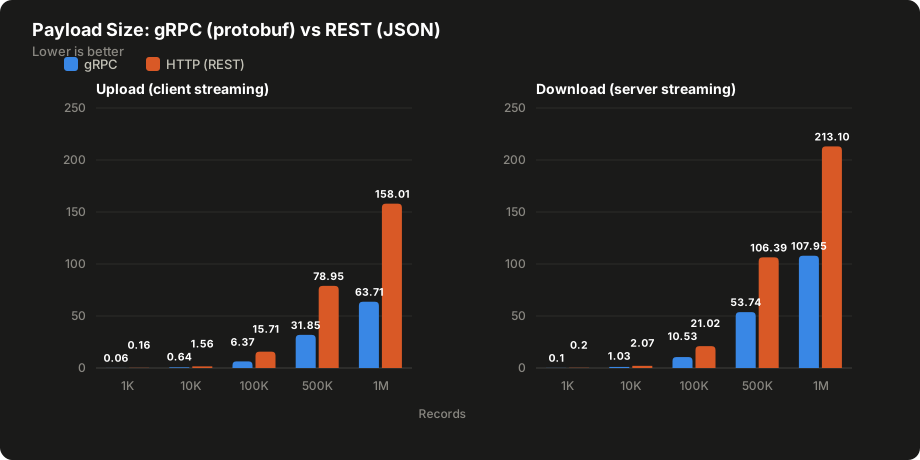
And the payload size (MB) for the same scenarios, where protobuf’s serialized size consistently comes out smaller than JSON’s:
Observations and Takeaways
Once batched, gRPC streaming beats REST across the board, and the gap widens as record counts grow: at 1 million records, upload time differs by 3.6x (296ms vs 1,080ms), and download time by 3.9x (436ms vs 1,694ms).
The gap in payload size is one of the main drivers of the performance gap. With the same 8 fields and the same record count, protobuf’s serialized size consistently comes out to about 40%-50% of JSON’s (at 1 million records for download: 108MB for gRPC vs 213MB for HTTP). The reason isn’t hard to see: every JSON record repeats the field name (like "shippingAddress") as a key, while a protobuf field tag is just a 1-2 byte number — and at scale, that small difference per record adds up to something substantial.
Streaming’s performance advantage comes from amortizing the fixed overhead per message. Sending record-by-record (one message per record) doesn’t show much difference at small volumes, but as data volume grows, the per-message framing/serialization/scheduling overhead stacks up fast — and, as I found out the hard way in this exact test, can straight-up blow out your memory. That also validates why gRPC’s flow control mechanism exists in the first place: using it naively in production is genuinely dangerous.
Worth noting: these numbers come from local loopback testing. In a real network environment — with actual latency and bandwidth limits — gRPC’s relative advantage should be even more pronounced, since a smaller protobuf payload means shorter transfer time. But the exact multiplier still needs to be verified against a real network before drawing a firm conclusion.
A War Story: Sending Record-by-Record Blew Up My Memory
My first version had the client call onNext() once per record — no batching, no flow control check whatsoever. Turns out this approach performs far worse than batching at scale: at 500,000 records, the record-by-record version took 6,000ms+, while the batched version was in the ~100ms range.
Push it to 1,000,000 records and it gets even more dramatic — the record-by-record version blew out gRPC-netty’s direct memory buffer entirely, throwing:
OutOfMemoryError: Cannot reserve 2097152 bytes of direct buffer memoryThe cause: the client side was hammering onNext() via the async stub without ever checking isReady() (i.e., no flow control), so messages were being produced far faster than the network could consume them. Netty’s outbound buffer just kept accumulating until it hit the memory ceiling.
Makes sense in hindsight — nobody actually sends records one at a time in a real large-volume scenario; it’s simply not a usable approach in practice. So the final benchmark only kept the one comparison that’s actually meaningful — batched streaming vs. a single big REST payload — and dropped the record-by-record version from the benchmark entirely. (That said, the record-by-record methods for both RPCs are still kept in SensorServiceImpl / OrderServiceImpl, as basic teaching examples for small-data scenarios.)
Known Limitations
- The test ran over loopback on a single machine, without simulating real network latency or bandwidth limits.
- Only a single run (plus one warm-up), not an average over multiple runs — the numbers are useful as a reference, not a precise benchmark.
- The REST control group used the JDK’s built-in
com.sun.net.httpserver.HttpServerplus Jackson, not a production framework like Spring MVC, so the overhead a real framework would add isn’t accounted for.
How to Reproduce
cd grpc_test
mvn compile
mvn dependency:build-classpath -Dmdep.outputFile=cp.txt
java -Xmx3g -cp "target/classes;$(cat cp.txt)" com.example.benchmark.StreamingVsHttpBenchmark
Alright, this round of testing gave me a concrete sense of gRPC’s performance edge in large-volume scenarios, and along the way I got a firsthand lesson in just how badly things go when flow control isn’t handled properly.
That’s it for this one. See you in some other blue moon.